Power BI: Building a Multi-Table Data Model
In this lesson, we will build a relational data model in Power BI. By connecting multiple normalized tables in a star schema, we create a flexible and efficient environment for analysis.
You can find all the resources for this lesson—including CSV files, the PostgreSQL schema, and the final Power BI template—in my GitHub repository: https://github.com/analysislessons/Article_PowerBIModel
Step-by-Step: Creating the Model
1. Import the Data Sources
Power BI offers multiple ways to ingest data. You can either load CSV files directly or connect to a PostgreSQL database for a more professional workflow.
A. Import From PostgreSQL Database
Connecting to PostgreSQL requires the database to be running and accessible.
-
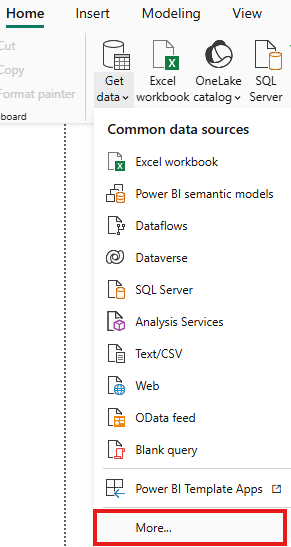
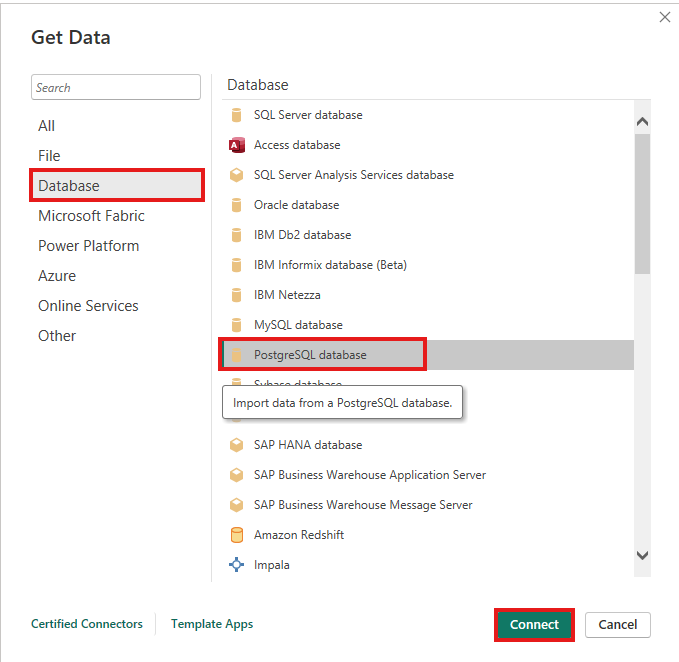
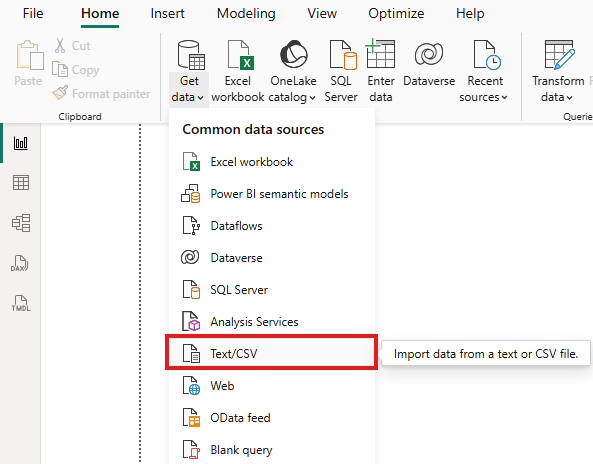
In Power BI Desktop, go to Get Data > More > Databases > PostgreSQL database.
-
Enter the Server (e.g.,
localhostor an IP address) and the Database name.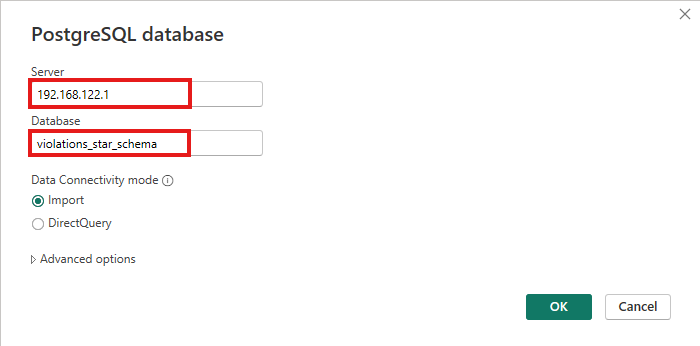
-
Choose your Data Connectivity mode:
- Import: Power BI takes a snapshot of the data (recommended for this lesson).
- DirectQuery: Power BI queries the database in real-time.
-
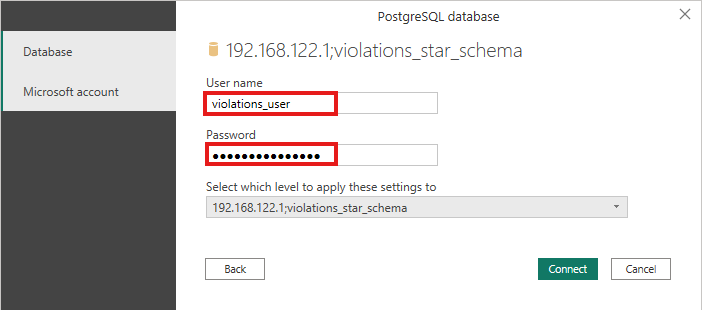
Enter your credentials when prompted.
After filling in the fields and clicking Connect, another window will appear. Select all tables and click Load.
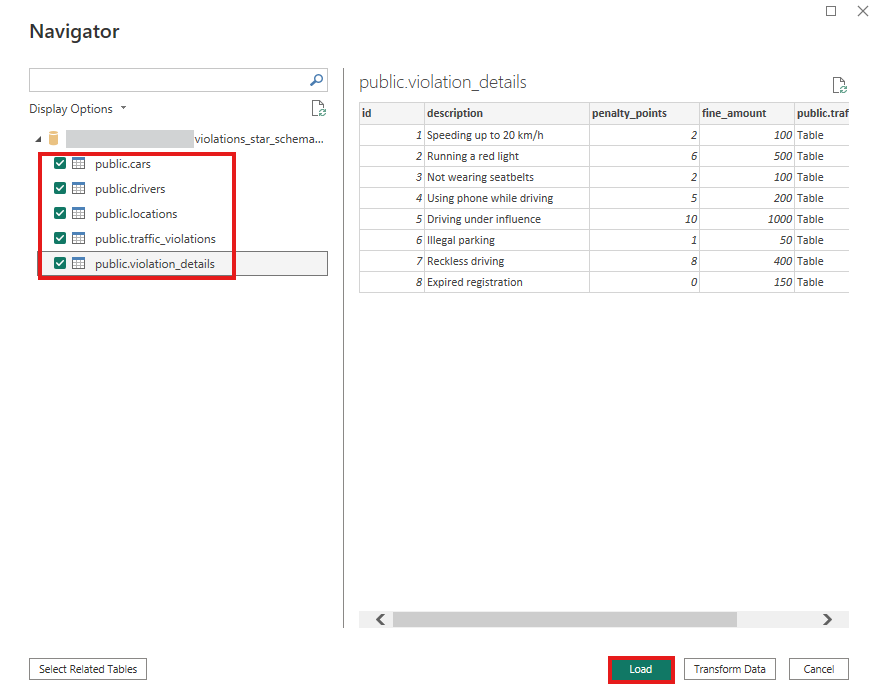
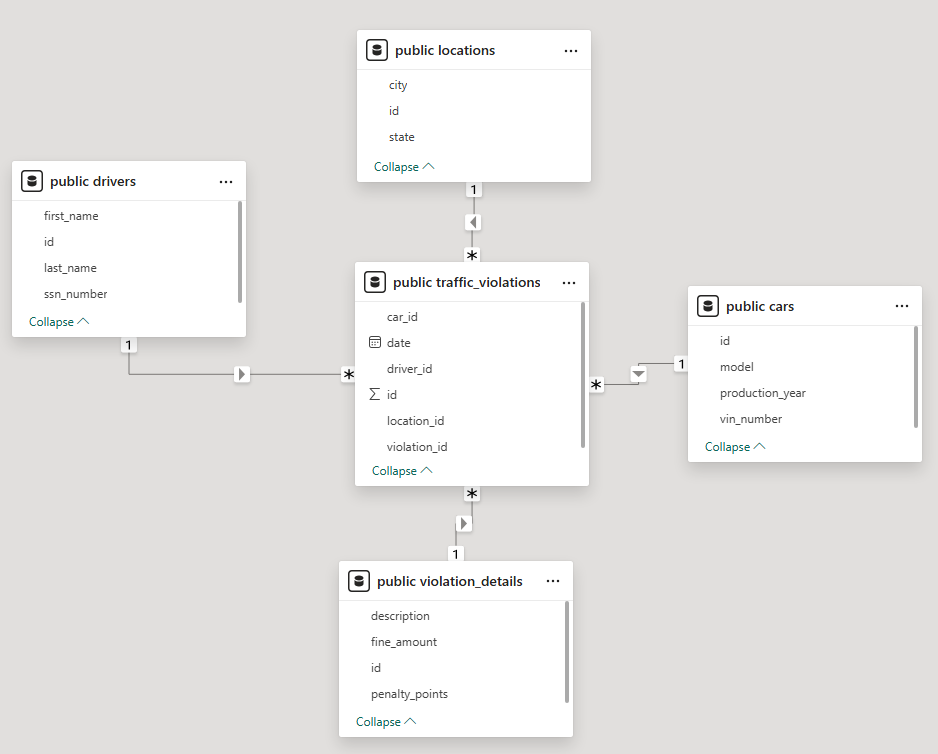
Then the tables will be imported, and relationships will be created automatically based on the database schema:
B. Import From CSV Files
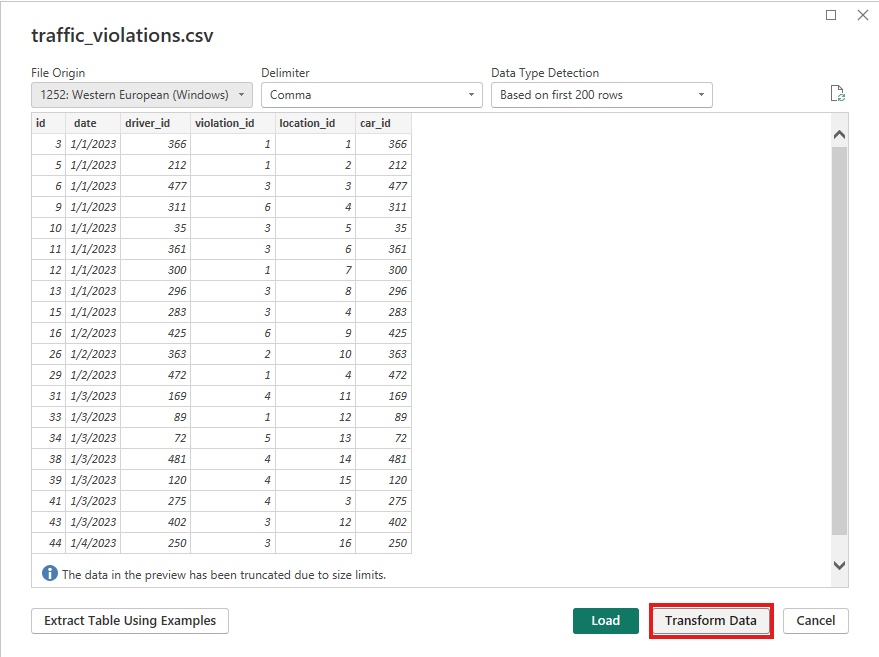
If you are using the CSV files, load all five:
traffic_violations.csv(The central fact table)drivers.csvcars.csvlocations.csvviolation_details.csv
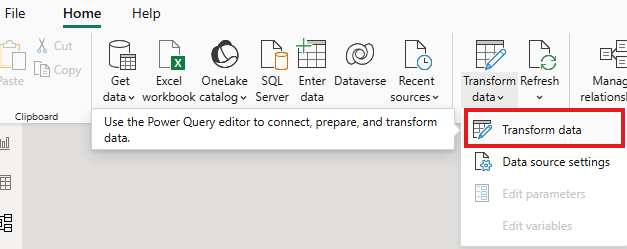
Use the Transform Data option to open the Power Query Editor and ensure data types (like Dates and Decimals) are correctly recognized.
2. Add a Dedicated Date Table
In Power BI, it is best practice to create a separate Date (Calendar) table rather than using the raw date column from your fact table. This enables Time Intelligence features.
Step-by-Step Date Table Creation:
-
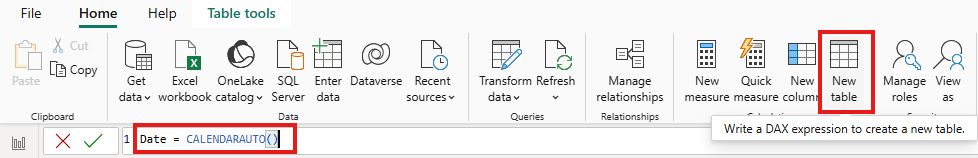
Go to the Home tab and click New table.
-
Enter the following DAX formula:
Date = CALENDARAUTO()
-
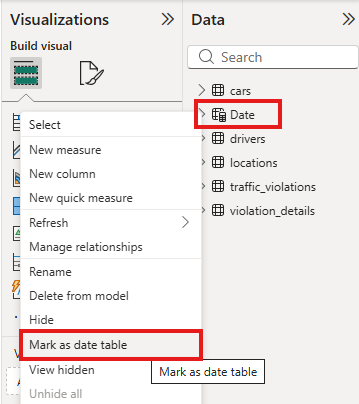
With the new table selected, click Mark as date table in the ribbon.
3. Define the Model View
Switch to the Model View (the third icon on the left sidebar). Here you can see your tables as boxes.
You can see that the tables are not organized.
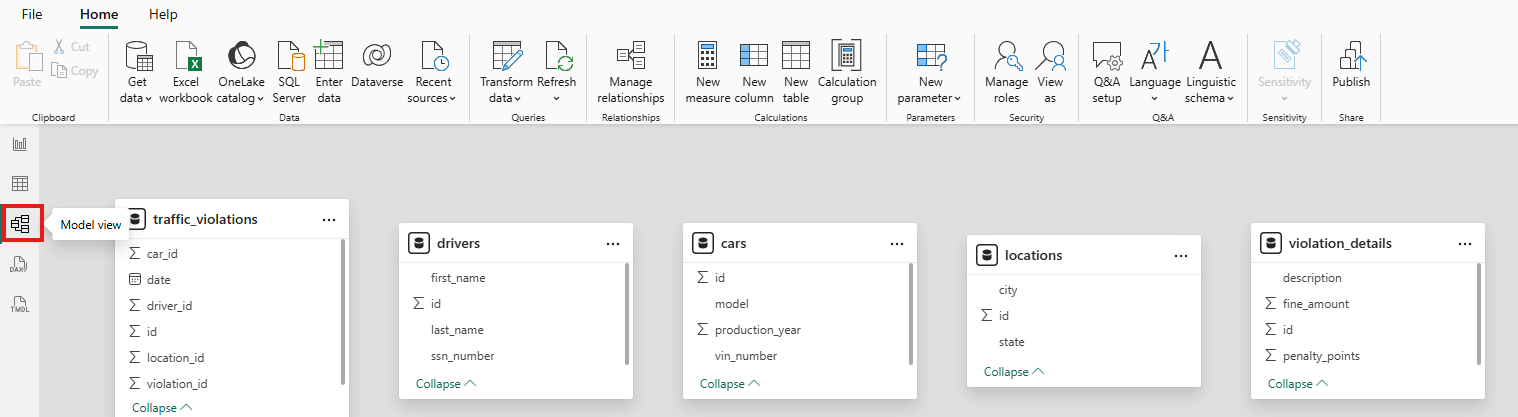
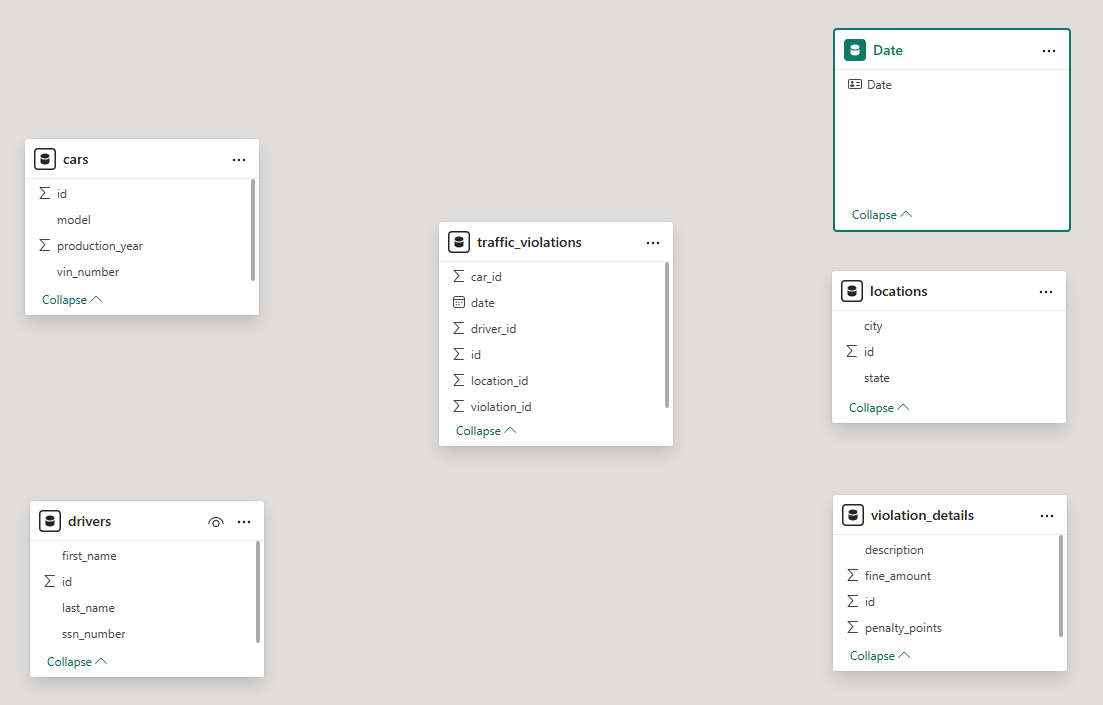
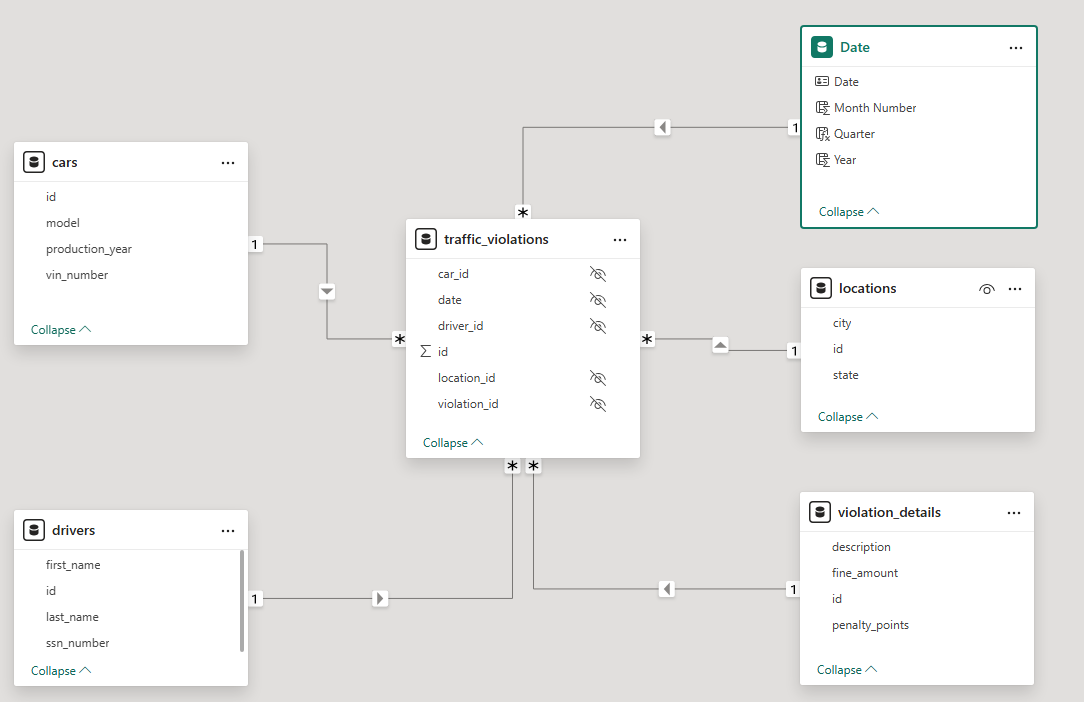
You can rearrange them by clicking and dragging. Set them up in a star schema: place the fact table, traffic_violations, in the center and arrange the other tables around it.
To create a relationship, drag a field from a dimension table to the matching field in the traffic_violations fact table:
-
Drivers:
drivers.id->traffic_violations.driver_id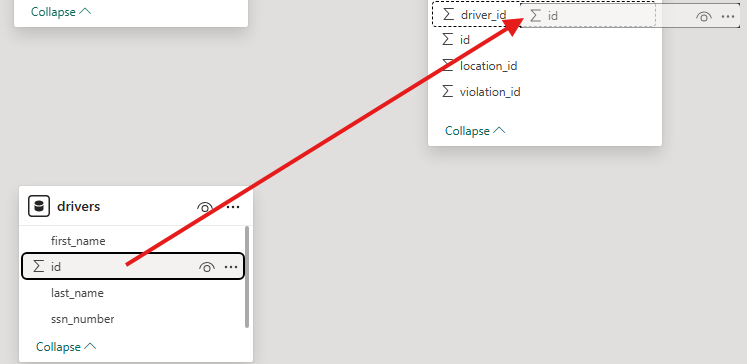
- Cars:
cars.id->traffic_violations.car_id - Locations:
locations.id->traffic_violations.location_id - Violation Details:
violation_details.id->traffic_violations.violation_id -
Date:
Date.Date->traffic_violations.date.
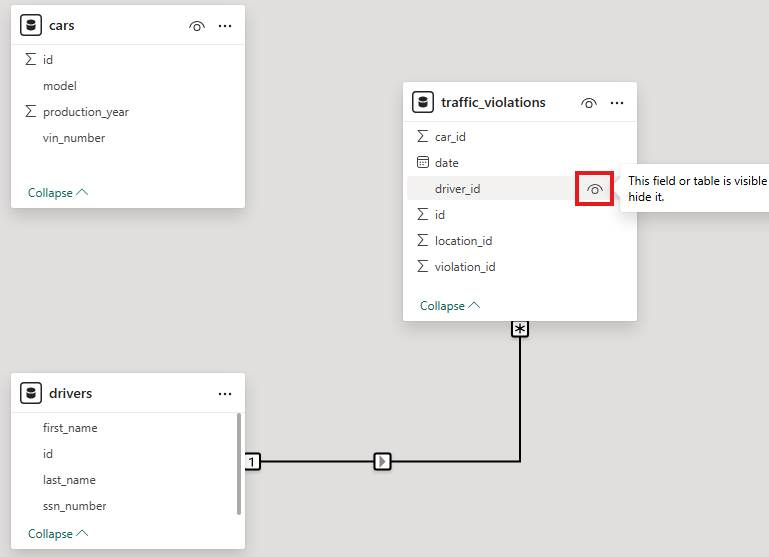
Best Practice: After creating this relationship, hide thedatecolumn in thetraffic_violationstable. This ensures all filters and slicers use the dedicated Date table.
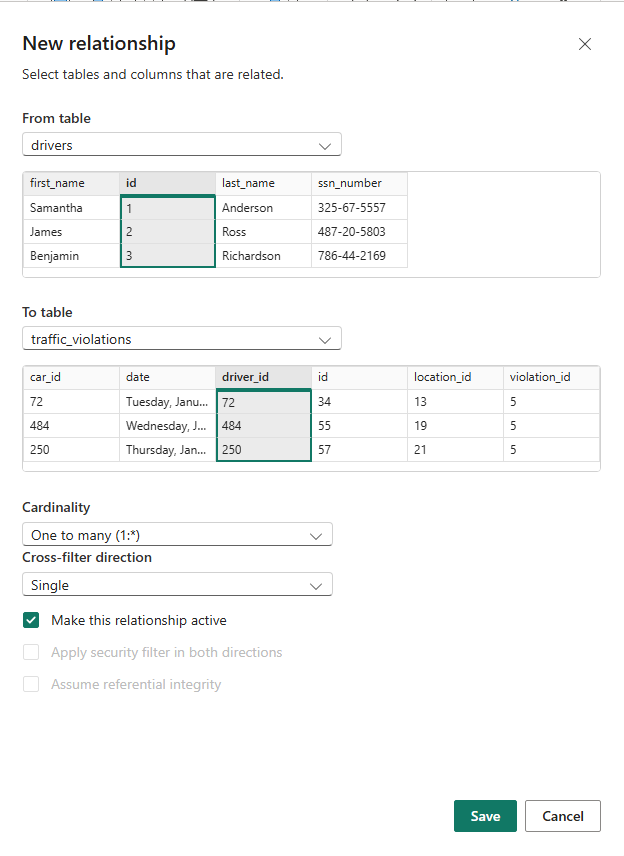
4. Configure Cardinality and Cross-Filter Direction
Double-click each relationship line. For a standard Star Schema, ensure:
- Cardinality: Many to one (*:1). The "Many" side should be the fact table (
traffic_violations). - Cross-filter direction: Single.
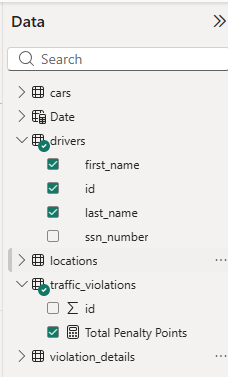
5. Best Practice: Hide Foreign Keys
In the Model View, select the foreign key columns in the traffic_violations table (e.g., driver_id, car_id) and set Is Hidden to Yes. This keeps your Report view clean.
6. Final Model
6. Verification: 4 Approaches to Calculating Penalty Points
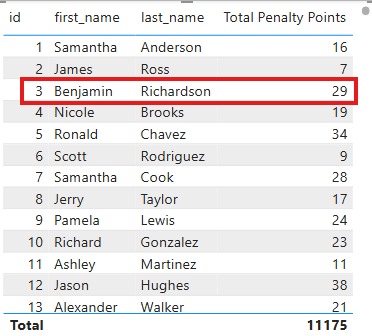
Let's try to calculate the total penalty points for each driver. We will use Benjamin Richardson (ID 3) as our test case. Benjamin has 5 violations in total (2x 10 points, 2x 2 points, 1x 5 points), so his correct total should be 29.
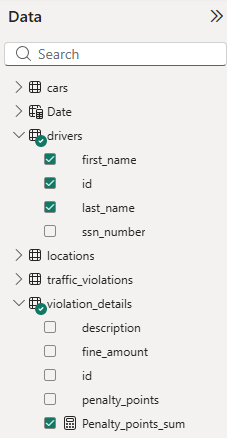
Approach 1: Implicit Aggregation (The "Wrong" Sum)
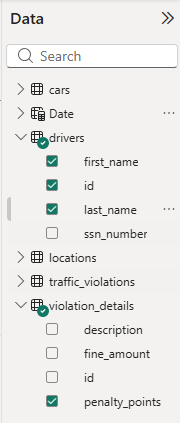
If you simply create a Table visual
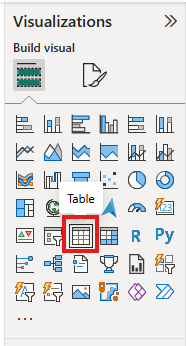
and drag first_name, last_name, and then the penalty_points column from violation_details directly:
- Result: Benjamin appears in 3 rows with values 2, 5, and 10.
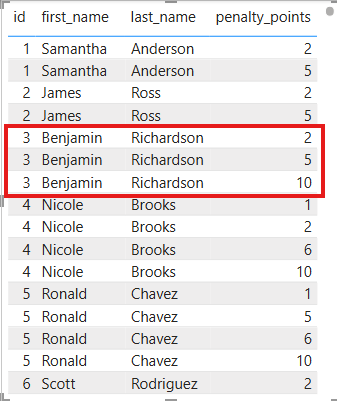
Why: Because you dragged a raw column from a dimension table, Power BI doesn't know it should sum them based on the event log. It simply shows the unique points associated with that driver through the relationship. It's essentially showing you the "types" of violations he committed.
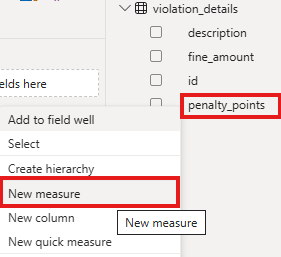
Approach 2: Simple SUM Measure (The "Stuck" Filter)
If you create a measure: Penalty_points_sum = SUM(violation_details[penalty_points])
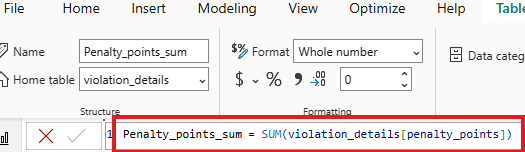
- Result: Every driver shows the same number: 34 (the sum of all unique violation points in the entire table).
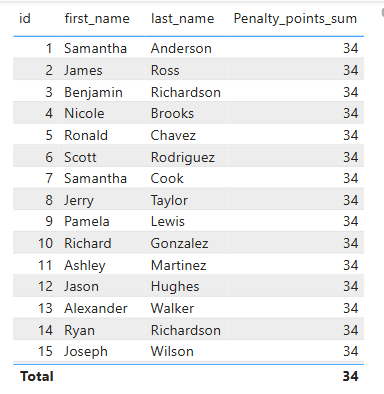
Why: This happens because filters flow from the "1" side to the "Many" side. When you filter by a Driver, the filter travels to the Fact Table but it cannot flow "backwards" to the Violation Details table. The SUM function calculates on the unfiltered dimension table.
Approach 3: SUMX + RELATED (The "Correct" Solution)
The professional way is to use an iterator measure:
Create this measure in the fact table, traffic_violations.
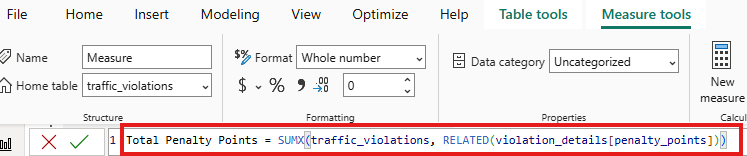
- Result: Benjamin Richardson correctly shows 29.
Internals:
- SUMX iterates through the
traffic_violationstable row-by-row. - Because the Driver filter is active, it only looks at Benjamin's 5 rows.
- For each of those 5 rows, RELATED reaches out to the dimension table to grab the points.
- Finally, it sums those 5 individual values together.
Approach 4: Create a Physical Join
Just like Tableau's Physical Join, you can use the Merge Queries feature in the Power Query Editor (the "M" engine) to join the points directly into the fact table before the data even reaches your model. This is often better for performance in very large models, as it simplifies the DAX needed to a simple SUM.
-
Open Power Query: In the Home ribbon of Power BI Desktop, click Transform Data.
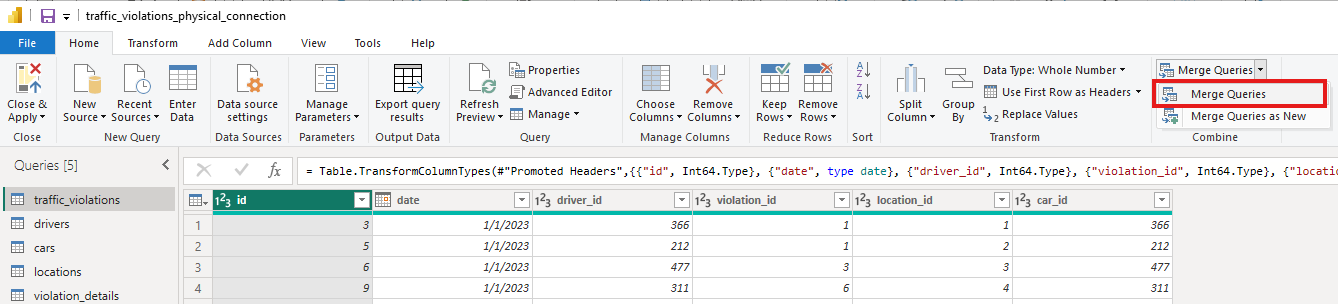
- Select the Fact Table: In the left pane, click on traffic_violations.
-
Initiate Merge: On the Home tab, click Merge Queries.
-
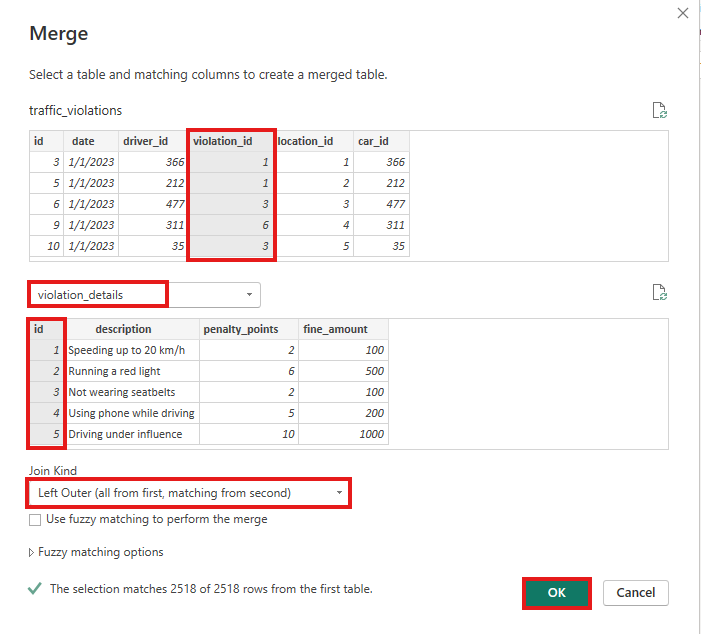
Configure the Join:
- In the top preview, traffic_violations is already selected.
- In the dropdown below it, select violation_details.
- Select the matching columns: Click on violation_id in the top table and id in the bottom table (they will turn gray).
- Join Kind: Leave it as "Left Outer" (this ensures you don't lose any violation records). Click OK.
-
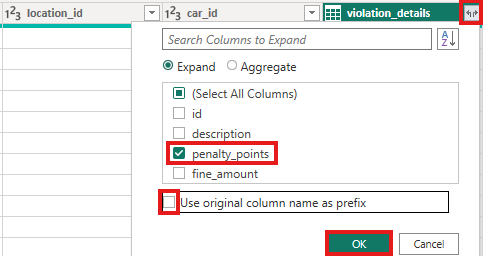
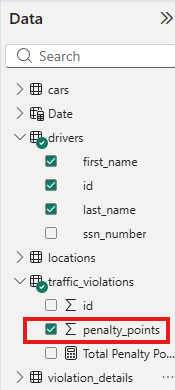
The "Expand" Step:
- You will see a new column named violation_details containing the word "Table".
- Click the small icon with two arrows at the top-right of that column header.
- Uncheck "(Select All Columns)" and check only penalty_points.
- Uncheck "Use original column name as prefix".
- Click OK.
-
Apply Changes: Click Close & Apply in the top-left corner.
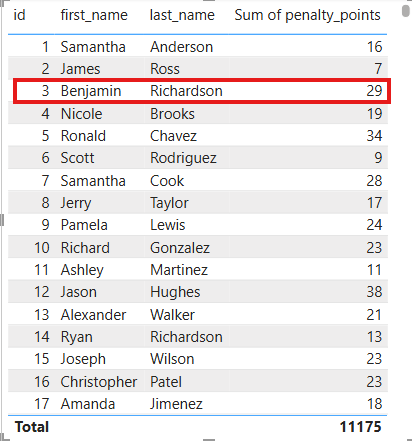
Result: Creating the same visual as earlier, but using this time penalty_points column directly from traffic_violations correctly shows Benjamin Richardson: 29.
Why this is the "Physical" equivalent:
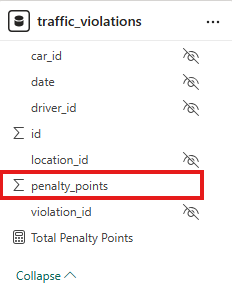
- Data Structure: traffic_violations table now physically contains a penalty_points column for every single row.
-
Simple DAX: You no longer need the complex SUMX(..., RELATED(...)) formula. You can now use a simple:
Total Points = SUM(traffic_violations[penalty_points])or just select the penalty_points column—it will be added to the visual, and an implicit sum measure will be created automatically.
- Performance: For extremely large datasets (millions of rows), doing the join during the "Load" phase is often faster than forcing the DAX engine to calculate the join every time a user clicks a filter.