Tableau: Building a Multi-Table Data Model
In this lesson, we will transition from a single flat table to a Relational Data Model in Tableau. By connecting multiple normalized tables, we create a more flexible and efficient environment for analysis.
Note: I am using the free version of Tableau Desktop, launched in early March 2026.
You can find all the resources for this lesson—including CSV files, the PostgreSQL JDBC driver, postgresql_schema.sql, and the final traffic_violations_model.twbx file—in my GitHub repository:
https://github.com/analysislessons/Article_TableauModel
Step-by-Step: Creating Relationships
1. Import the Data Sources
You can either import tables by directly loading the CSV files into Tableau or follow a more professional workflow by importing them from a database. Both options are explained below.
A. Import From PostgreSQL Database
This section assumes you have already installed PostgreSQL and created a database using the CSV files for this lesson. If you haven’t done so, you can follow my introduction to PostgreSQL here: PostgreSQL- Introduction
Additionally, the postgresql_schema.sql file in the GitHub repository mentioned above contains all the queries needed to create the tables and load the CSV data using psql or another client.
To connect Tableau to your PostgreSQL database, you will need the JDBC driver from the official PostgreSQL website: https://jdbc.postgresql.org/download/
On Windows, place the downloaded postgresql-42.7.10.jar file into the C:\Program Files\Tableau\Drivers folder. This will allow Tableau to establish a connection once you provide your credentials.
On macOS, the driver should be placed in ~/Library/Tableau/Drivers.
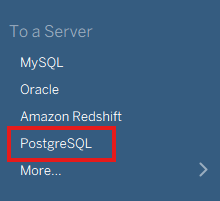
With the driver in the right place, click on PostgreSQL as shown below:
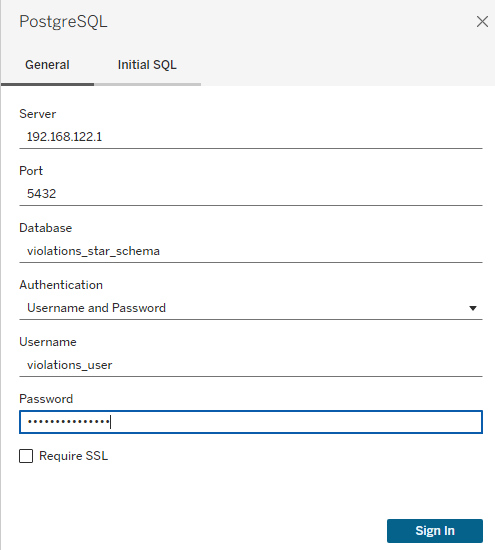
A new window will appear where you can enter the required connection parameters:
- Server: If PostgreSQL is running on your local machine, simply type
localhost. - Port:
5432is the default port used by PostgreSQL. - Database: Provide the name of your database.
- User/Password: Provide the credentials for a PostgreSQL user who is either the database owner or has read permissions.
After filling in the fields and clicking Sign in, the tables will be imported:
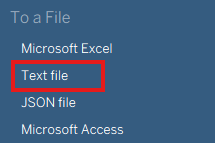
B. Import From CSV files
Load all five CSV files into Tableau:
traffic_violations.csv(The central fact table; load this first)drivers.csvcars.csvlocations.csvviolation_details.csv
2. Define the Logical Layer
Tableau uses a "Noodle" (logical relationship) to connect tables. Drag traffic_violations to the canvas first, then drag the other tables one by one to connect them to it.
3. Map the Relationship Fields
Below is an Entity Relationship Diagram (ERD) showing how the tables are logically connected using Crow’s Foot notation. If this is your first time seeing an ERD, I invite you to read my article where I explain how one-to-many relationships are built and how to represent them: One-to-many Relationships
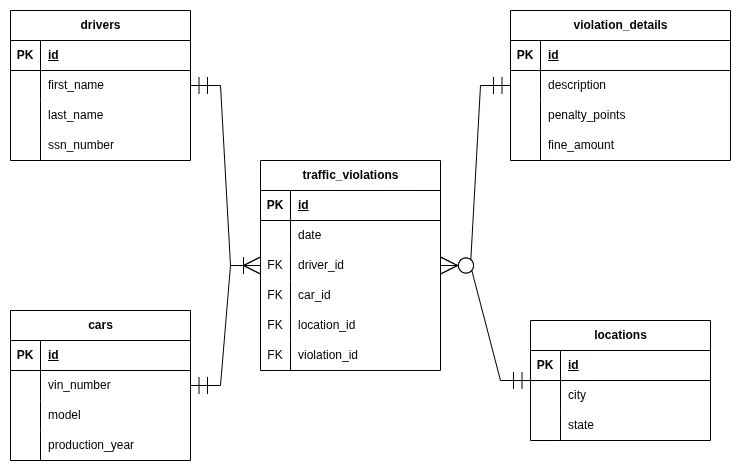
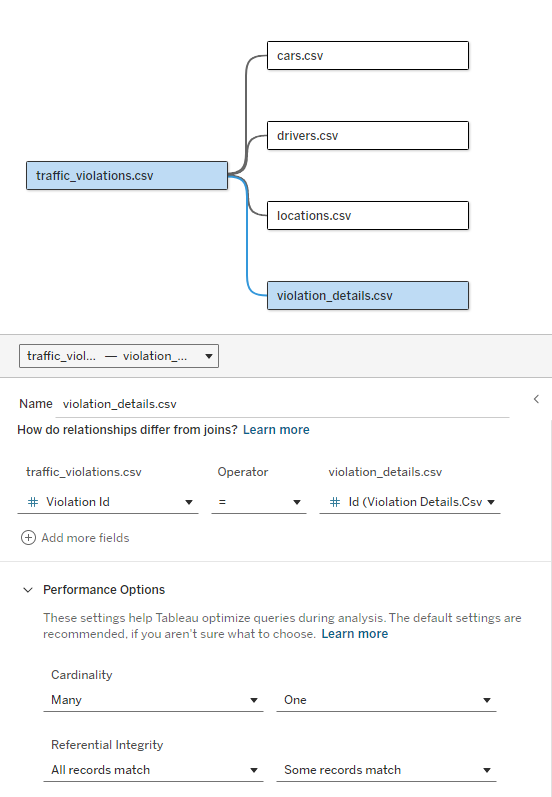
We need to tell Tableau how the tables are related by configuring the parameters to reflect the ERD diagram. For each connection, click on the "noodle" (the line between a dimension table and the traffic_violations fact table) and specify the matching columns:
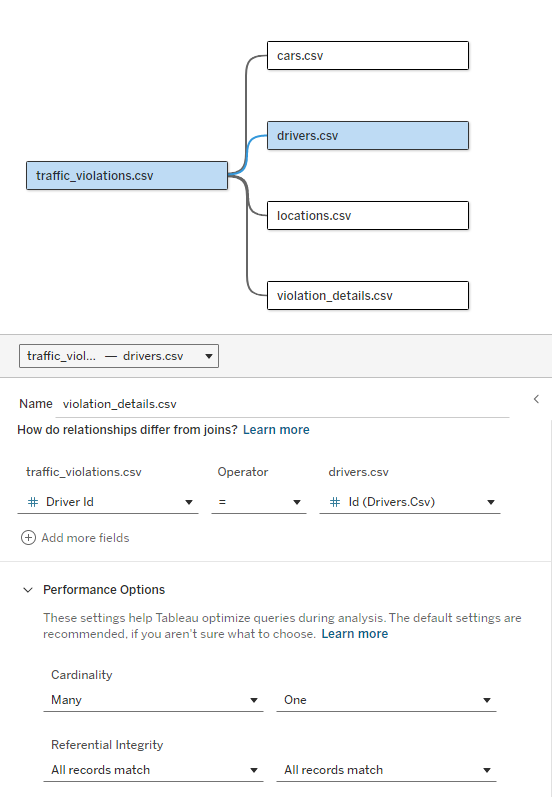
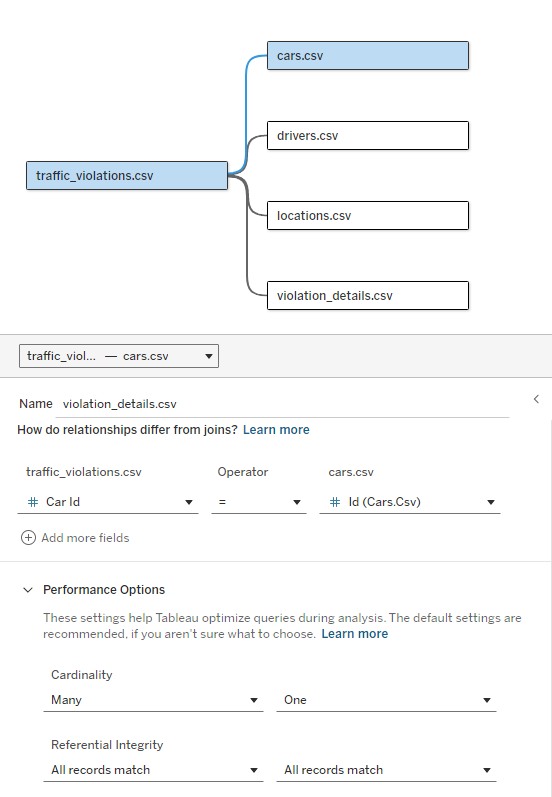
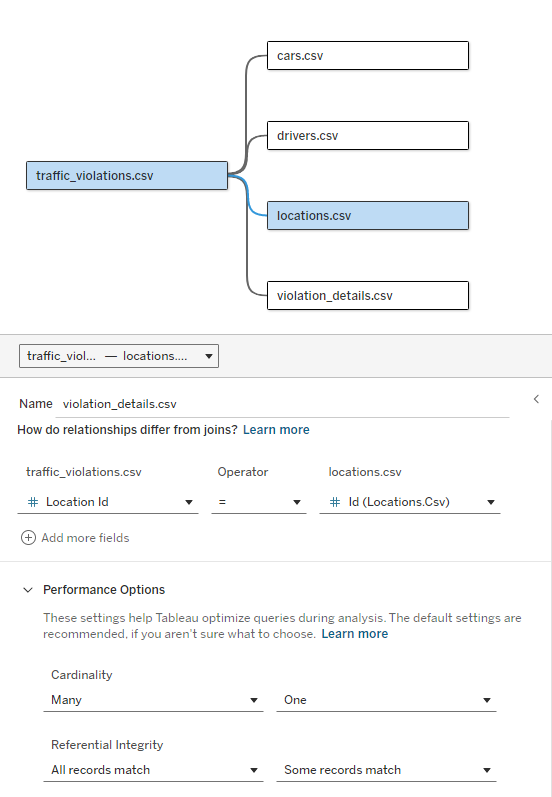
Note: Below are images showing the final settings that reflect the ERD diagram.
- Drivers:
traffic_violations.driver_id=drivers.id - Cars:
traffic_violations.car_id=cars.id - Locations:
traffic_violations.location_id=locations.id - Violation Details:
traffic_violations.violation_id=violation_details.id
4. Configure Cardinality and Modality
To optimize performance and ensure accurate counting, set the Performance Options for each relationship:
Mandatory Relationships (Many-to-One)
For Drivers and Cars, we know every record in our violation log must have a matching driver and car:
- Cardinality: Many-to-One (Many violations to one driver/car).
- Referential Integrity: "All records match."
Optional Relationships (Many-to-One)
For Locations and Violation Details, we have entries (like a city or violation type) that might not have any associated violations yet:
- Cardinality: Many-to-One.
- Referential Integrity: "Some records match."
Drivers:
Cars:
Locations:
Violation Details:
Further information on optimizing relationship queries can be found in the official Tableau documentation: https://help.tableau.com/current/pro/desktop/en-us/datasource_relationships_perfoptions.htm?source=productlink
5. Verify the Model
Go to a new Worksheet. You should see all five tables listed as separate entities in the Data pane. Tableau will automatically handle the joins behind the scenes based on the fields you drag into your visualization.
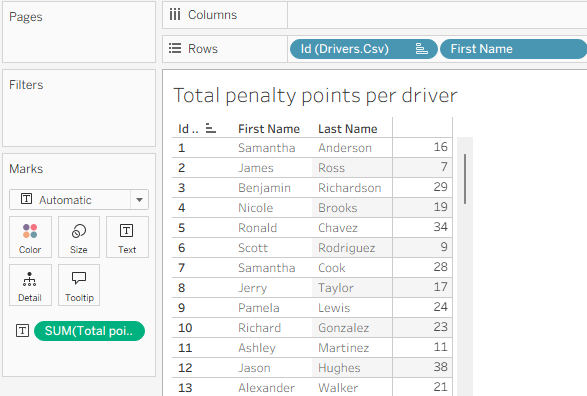
Below is a basic text table created based on this dataset using the Noodle (Logical Layer) connection. While it proves that all tables are correctly connected, it reveals a subtle calculation issue caused by Smart Aggregation.
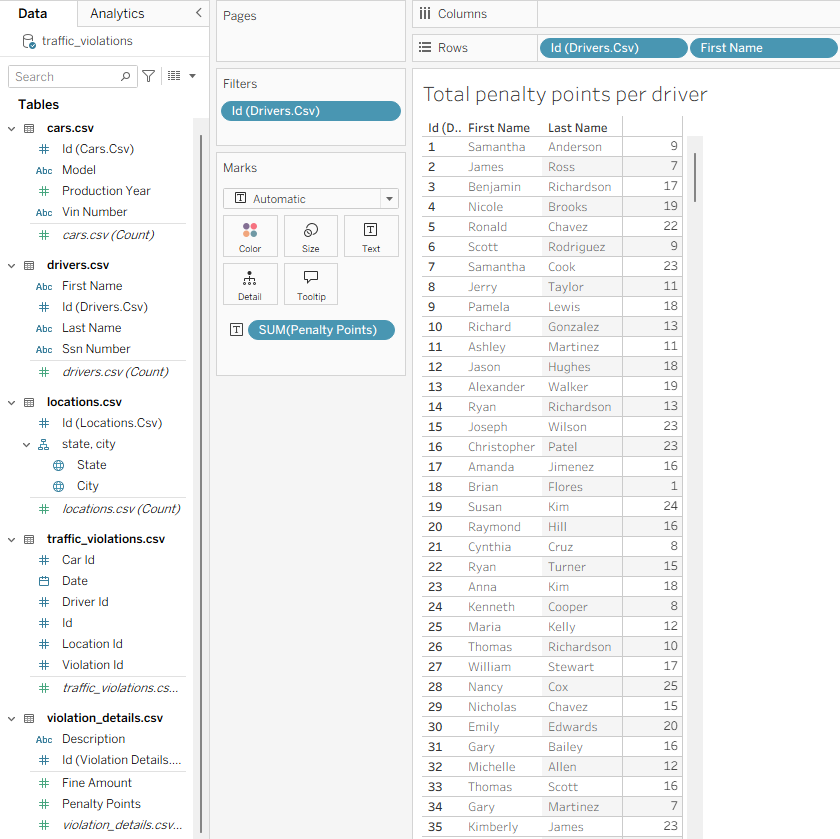
Note that for some drivers, the total penalty points might seem lower than expected. This is because Tableau’s Relationship engine protects the "1" side of the data (violation_details). If a driver committed the same type of violation twice (e.g., two speeding tickets), the "Smart Aggregation" algorithm might sum the points for that violation type only once.
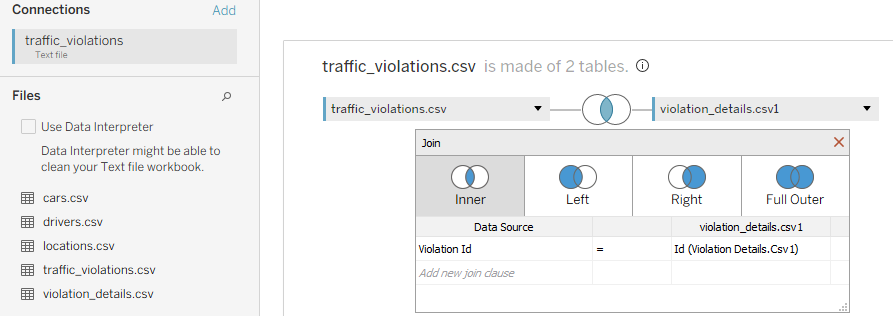
Alternative 1: Using a Physical Join
To force Tableau to count every single row in your fact table, you can move from the Logical Layer to the Physical Layer.
- Double-click the
traffic_violationstable in the Data Source tab to "open" it. - Drag
violation_detailsinside and create a standard Inner Join.
This creates a flat rowset where the points are duplicated for every event. In the Data pane, you will see the columns from both tables merged into a single physical entity.
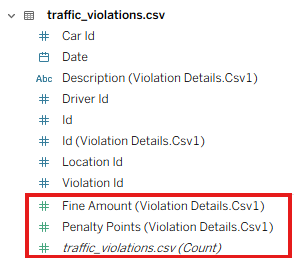
Now, a simple SUM([penalty_points]) will correctly reflect every single violation committed by the driver.
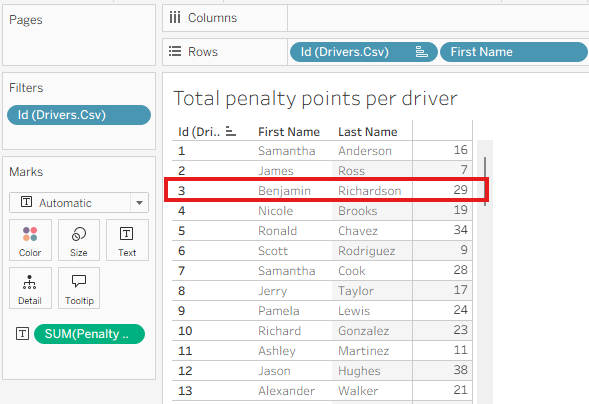
Compare the results for driver Benjamin Richardson (ID 3). The total penalty points calculated for him are now 29, whereas in the previous approach they were only 17.
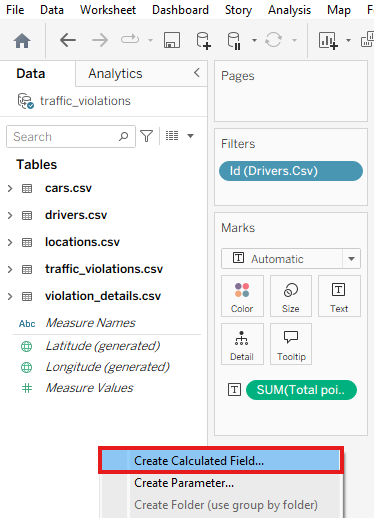
Alternative 2: Using a Calculated Field (LOD)
If you prefer to keep the tables separate in the Logical Layer (Noodles), you can override the Smart Aggregation by creating a Level of Detail (LOD) Expression.
Create a new calculated field that fixes the points to each unique violation event ID:
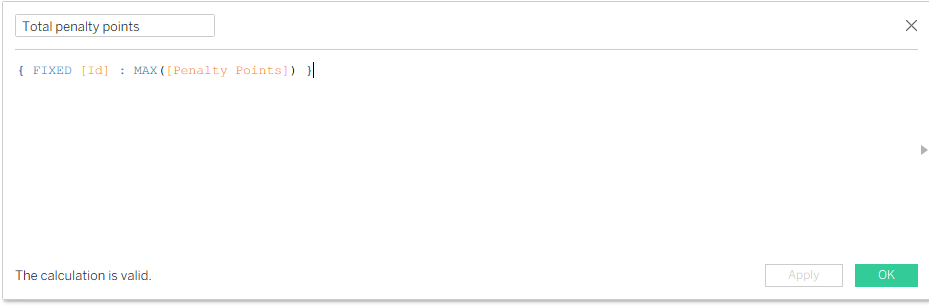
When you use this new field in your visual, Tableau will aggregate the points for every unique event first, then sum them up for the driver, resulting in the correct total.